
Auto-Scaling Vertica Clusters


With consumer purchase data, business questions are only limited by imagination.
- What is the purchase frequency for Pepsi among Hispanics in the Northeast?
- Share of wallet Amazon has among regular K-Cup / Coffee Pod buyers?
- Bang Energy Drink, is it stealing sales from Monster or Red Bull?
This level of flexibility is of paramount value to our customers, and our ability to provide answers in the order of minutes as opposed to weeks is a key differentiator.
As you can imagine, pre-computing these is prohibitively expensive. Not only is it a lot of data (5+ years of now 100,000+ panelists), but these questions depend on an exponentially big parameter space of data attributes. How do we work around it? Part of our strategy involves Vertica.
What is Vertica? How do we use it?
Vertica is a massively-parallel, column-store database that excels at computing aggregate functions on a small number of columns (e.g. SELECT AVG(price), SUM(total) FROM table). As we scaled up over the years, we noticed several small clusters performed better than one big cluster. We now use six, three-node clusters during peak hours.
Though perhaps unconventional, we throw away all the data and re-ingest it from ETL on a daily basis. Mainly because everyday we get better at enriching our historical dataset and selecting a set of users to represent a 'mini America'.
Why auto-scale?
Money. 🤑

Vertica has special hardware requirements and we use c5.9xlarge (read: 'expensive') AWS EC2 instances to run it along with eight 500GB ST1 (read: 'expensive') EBS volumes each. But after 5:00pm and on the weekends only very few overachieving clients use our Insights platform. So the 'cloud promise' of only paying for what you use? Broken.
How'd you do it?
AWS AutoScaling doesn't help here because our unit of scaling is a cluster (one load balancer and three EC2 nodes), not a stateless EC2 instance.
Still, at a high-level its not too complicated. We just have 2 tables in DynamoDB that store the 'cluster status' and the 'schedule'. Then we run a Jenkins Pipeline hourly that either scales up or down as needed. There are a couple takeaways here:
1. Separate decision making from actions
We wrote one Python script that decides –based on how many clusters are up and how many the schedule says should be up– what to do. We also wrote two other scripts for executing the actions of bringing up and down a cluster. The Jenkins Pipeline orchestrates running the decision script and calling the right action script.
This design makes it very easy to test. We wrote 45 unit tests that run in 1.3 seconds total and give us the confidence that we won't turn off clusters in the middle of day or scale up to 100 clusters. 😀
2. Idempotency, idempotency, idempotency.
This is a distributed system, and like any other, failure should be expected. Having the Python action scripts safe to re-run has helped tremendously in a couple emergency situations.
Idempotency makes the scripts easy to think about, because you can just 'run it again' no problem.
3. Leverage the AWS Console for management tasks
We built a CLI to manage and view information about this system. Ehem... a GUI is much better than a CLI, and the AWS Console is exactly that. Who knew you can edit DynamoDBs directly from the AWS Console? 🤦♂️
4. How to store a 'schedule' in a database?
This one is not too bad, but a great way to store a schedule is by having a table with what I call 'non-overlapping intervals that span a whole week'.
Rows are intervals (day_of_week, start, end, num_clusters), where start and end are minutes-of-the-day quantities that can be easily represented by integers. Then you ensure its contents 'span' ('cover') every instant in the week. It looks like this:
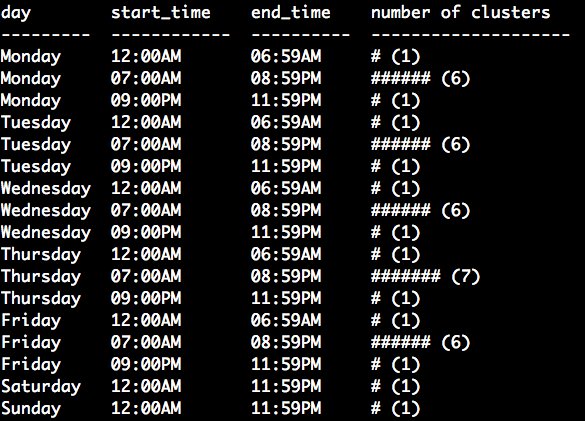
*There are a couple 'unspoken constraints' (e.g. no rows should 'overlap'), but its not too bad if you make the Python code that reads the table validate data integrity on every use (and fail-fast).
5. Create a standard for every script
Lastly, its important for code to be debuggable. The following helps:
- Use Sentry in every script.
- Support --help with documentation.
- Support a --log-level flag that translates to a uniform use of the
loggingmodule talking tostdoutand to a file collected by CloudWatch.
We created a shared function that takes in an argparse.ArgumentParser and a logger to automatically ensure the above capabilities for you.
Results
This project has been a great success for the team. After some baby-sitting and a careful release, we now avoid paying for 10 hours of 18 c5.9xlarge EC2 every day.