
Requests are all you need - CPU Limits and Throttling in Kubernetes

Background
At Numerator, the Deep Learning Team hosts numerous models as a collections microservices on Kubernetes. We have a variety of building blocks in our architecture that allow us to build more complicated pipelines and processing steps. At the core, we have a fairly large number of pods that are a FastAPI app serving a transformer PyTorch model. Although a few models are hosted on GPU, the majority are hosted on CPU for financial reasons. We have an internal library that makes all of that hosting very easy, but that deserves its own discussion.
Last year, after moving several pods from a 4 vCPU node to a 16 vCPU node, we started encountering a significant increase in throttling alerts and degraded performance. This was especially strange as the only thing that had changed was the core count (and memory quantity), it was even the same AWS family of c5 nodes. This led to a deep dive into Kubernetes systems, multiple experiments, and ultimately this blog post.
What are requests and limits
In Kubernetes you can set a request and/or limit for each of your pods. But what do each really mean?
As a side note, this blog post is exclusively diving into CPU request and limit, memory will not be discussed in depth; however the deep learning team follows the recommendation of setting request and limit equal for all deployments[1]. An additional note, in some situations “pod”, “container”, or “process” might be the better term; but for simplicity, and high level clarity, I will sacrifice technical correctness and I will use the term “pod” in all locations when talking about request, limit, and Kubernetes.
Request
Per Google Cloud documentation[2], a request is what the container is guaranteed to receive. One of the most common discussions of requests is around pod scheduling. Kubernetes will only schedule a pod on a node that has enough resources to meet the requested resources. For example, if a pod requests a total of 2 CPUs, but each node only has 1.9 available, Kubernetes will not schedule the pod.
Limit
Again per Google Cloud documentation[2] and others, a limit is a cap on the resources that a pod can use. Although small exceptions may exist, this is a very hard cap that Kubernetes[3] enforces. An important note is that the CPU is considered a “compressible” resource. As such, if your container attempts to exceed the limit, Kubernetes throttles it. This may result in degraded performance, but does not terminate or evict the pod. However, if a pod attempts to use more memory than the limit, Kubernetes immediately terminates it.
Limits deeper dive
Conventional wisdom
The conventional wisdom is that you should always set requests and limits for both CPU and memory. Kubernetes documentation[4] warns that if you do not set a CPU limit,
The Container has no upper bound on the CPU resources it can use. The Container could use all of the CPU resources available on the Node where it is running.
You can find similar warnings and recommendations in many places around the internet, including containeriq.com, learnk8s.io, and komodor.com.
The mental model of limits
With a virtual machine (VM), you assign a certain whole number of vCPU cores. These are then available to the VM all of the time. However, Kubernetes allows you to specify fractional CPUs, down to 1/1000 of a CPU. Unlike in the case with virtual machines, you cannot assign only part of a CPU core. It is instead a timeshare of the CPUs available on a node. This is true even if the limit is set to a whole number. This can be important as we explore how this works.
Cgroups and CFS
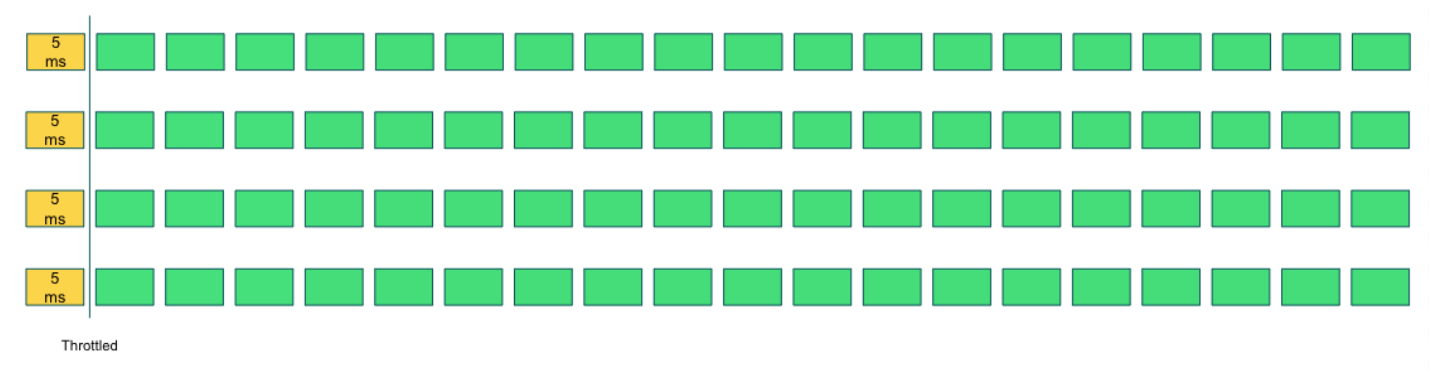
Kubernetes uses the Completely Fair Scheduler (CFS) cgroups, specifically the CFS Cgroup Bandwidth control. The way this works for a CPU limit is that every CPU is scheduled in 100ms periods with 5ms time slices. Each pod is given a budget within that time slice. For example, a pod with a limit of 200m, the pod would be given a quota of four 5ms slices for a total of 20ms of every 100ms period.
Approaching the limit and throttling
The CFS continues to supply these 5ms slices to the pod until the quota has been exhausted. Once the quota has been used up for the 100ms period, the CFS stops scheduling the pod for CPU time. This is referred to as throttling. Once the new 100ms period begins, the quota is reset to the limit. In our example, this is four slices.

So far we have only discussed this in terms of a single CPU. However most servers have multiple CPU cores available. This may lead to the somewhat surprising result that our 200m limit pod could exhaust the entire quota in the first slice across four CPUs.
Throttling as a metric
I want to take a brief diversion to discuss the throttling metric. Many people, us included, set up alerts to see when a server is throttling as a warning of a potential problem (or a misconfiguration). However, if you do this you may find high throttling with very low CPU utilization.
Let us return to the example of a pod with a limit of 200m running on a single core machine. Let us pretend we expect it to process 1 request every second and each request should take 70ms to complete. Given that, over a 1 second period the pod will be using only about 35 percent of the limit set. However, for each 100ms period the pod is only allowed to use 20ms before being throttled, as we saw above.
So for the first slice the pod uses 20ms and is throttled. In the second slice and third slice, we see the same. Finally in the fourth slice, the pod uses 10ms of CPU and completes the request. For the remaining six slices, the pod does not request any CPU time. So for three of the four periods where the pod requested CPU, it was throttled. The latency of 70ms has grown to more than 300ms. So despite the pod only using 35 percent of our limit on a large timescale, this pod is getting heavily throttled and the response time is degraded.

Multiprocessing and limits, a warning
Normally in Kubernetes, you would think that a simple pod would be ambivalent to the host node it is running on. This is assuming the same CPU cores, etc. Just changing the number of cores. However, this is not always the case. I devised a number of tests to show this effect. For illustrative purposes, I will show the results of the most extreme version.
I took an unmodified NGINX official Docker image and specified a limit of 100m. I performed a load test from inside the cluster using ApacheBench (ab) requesting the default homepage[5]. First, I scheduled this pod onto a host node with 2 vCPU (AWS c5.large). I was able to achieve over 1200 requests per second (rps) with 99 percent of requests completing in under 200ms. I then moved this exact same pod over to a node with 96 vCPU (AWS c5.24xlarge) using the same CPU cores. I did the exact same load test as before. On this new node, the pod was only able to sustain 455 requests per second, or only 37 percent of the throughput. The latency on the 96vCPU server was worse across the board as well, with 10 percent of requests taking more than 400ms to complete and the longest taking over 12 seconds.
| Nginx on 2vCPU node | Nginx on 96vCPU node | |
|---|---|---|
| Throughput | 1,221 rps | 455 rps |
| P50 Latency | 98 ms | 100 ms |
| P95 Latency | 104 ms | 1,000 ms |
| P99 Latency | 195 ms | 2,500 ms |
This may sound far-fetched, but the Deep Learning team ran into this exact problem when moving our PyTorch models from a 4 vCPU node to a 16 vCPU node. Attempting to fully understand and diagnose the problem is what led to this research and testing. If you have any workload that is able to spread itself across the CPU cores of the node, limits may have strange effects on the performance of the pod.
Requests
If you are like me, you may at this point think to yourself, “This sounds bad, but I still have to follow the recommendations and dire warnings around limits. I guess I’ll just learn to tune my req/limit for each type of node I run?”. However, it turns out those warnings may be a bit overblown, if not straight up wrong. If we look back to the top of this blog post, I quoted Google saying that “Requests are what the container is guaranteed to receive”. What exactly does that mean and how does that work?
Requests and cgroups
When I was first learning Kubernetes, it was explained that requests were used by the scheduler to understand if the pod would fit in the available resources of a node. However, that is not the whole story. According to the Kubernetes documentation[6], requests are also used as a weighting mechanism for assigning CPU time in situations where CPU time is contested.
So if Pod A has a request of 100m CPU and Pod B has a request of 200m CPU and both attempt to use CPU time, Pod B is twice as likely to get the CPU time on average. That is the first piece of the puzzle. The second is that the scheduler will not (under most circumstances) schedule more requests on a node than there are resources. Since the sum of the weights will not exceed the available resources, the pods’ weight is (at a minimum), always going to get the requested resources (on average).
For example, we have a single node with 1 CPU. First Kubernetes will take a small amount of resources for itself to manage the node, around 6m CPU. Second, we put Pod A requesting 100m CPU, Pod B requesting 200m CPU, and Pod C requesting 694, all on the node. That matches exactly our one CPU on the node. Of course in the real world, you would never perfectly fill a node, this is just the worst case. If every Pod demands CPU at the same time, we can see that Pod A will have a weight of 100, the total weight is the sum of all the requests (6+100+200+694) or 1000m. So the average amount of CPU Pod A will get is (100/1000) * 1000m CPU or 100m CPU, exactly our request. Hence the “guarantee” from earlier. The exact calculation is a bit different than I have explained it here, but this is close enough for a high level understanding.
Putting it to the test
The information about the requests being a guarantee seems to be at odds with the warnings if you do not set a limit. The warnings seem to imply that a bad pod will consume all the resources on a machine and prevent the node or other pods from running correctly. To test this theory I created a test.
For this test I created two different kinds of pods. The first was what I called “Well-Behaved”. This was a multithreaded web application that did a reasonable intensive calculation before responding. The second was what I called “Misbehaved''. Misbehaved, once triggered, would attempt to consume all resources on the node and eventually itself become unresponsive. Since the health checks were disabled, the pod was allowed to live in this state indefinitely and try to consume all CPU resources. On a 4 vCPU node, I put three Well-Behaved pods alongside one Misbehaved pod, each with a request of about 1 CPU (a little bit less to make room for overhead).
I had two variables in the test, limits and requests on all pods versus only using requests on all pods, and misbehaving pod triggered versus idle. I performed the same load test for each of the four permutations. Each time I recorded the average throughput in requests per second of the three Well-Behaved pods for the duration of the five minute test.
| Misbehaved Triggered | Misbehaved Idle | |
|---|---|---|
| Request & Limit | 155 rps | 159 rps |
| Request Only | 179 rps | 218 rps |
This shows that the Misbehaved pod did not take all the resources from the Well-Behaved pods after all. The node continued to function well and all other pods were able to function due to their CPU request. Additionally, notice that the Well-Behaved pods had overall better performance when I did not set limits. I believe this is due to the pods not being subject to the harsh penalties of throttling, as described above.
It is worth pointing out that in the situation where only the Well-Behaved pods were running and encountered very high load, they were allowed to spike and consume extra resources on the node. There are two potential benefits to that result. One is that you have a short term burst that is able to meet the demand of the incoming load. The second is that standard HPAs in Kubernetes use the actual CPU utilization over the requested CPU. So the high spike in CPU utilization will allow the HPA to scale faster in response to this new load.
Ultimately we see that setting a CPU request does indeed guarantee the pod will get the resources if it is needed. But additionally gives you some burst capacity and potentially more responsive scaling.
Closing thoughts and Recommendations
Recap
As demonstrated above, setting CPU requests for a pod provides solid guarantees about the CPU resources a pod will get at runtime. Even if a misbehaving pod attempts to steal all the resources, the pod will (on average) get exactly the requested CPU resources.
Additionally, CPU limits are very tricky to implement. The CFS does an outstanding job; however it has some unintuitive implications and side effects, especially on multithreaded workloads on high core count nodes. A workload might be heavily throttled, even at low CPU utilization. Multiple demos and the Deep Learning team’s experience have shown significant detriment to throughput and latency when a Pod has reasonable limits set.
Recommendation
After finding these issues, reading the growing concerns over limits and throttling, and conducting our own tests, the Deep Learning team decided to completely ditch CPU limits in our cluster. We made this change about a year ago and things have been incredibly smooth since then. This result has been replicated by other teams at Numerator. So to summarize, we follow and endorse Tim Hockin’s recommendation[1]:
- Always set memory limit == request
- Never set CPU limit
Footnotes
[1] Tim Hockin - Google Cloud Principal Engineer - Kubernetes / GKE https://twitter.com/thockin/status/1134193838841401345
[3] Technically the linux kernel, but we are getting there
[5] ab -t 120 -n 100000 -c 100 http://[pod-ip]/ from within the cluster